

Timmy Chan

Data Visualization
Web Scraping and Data Visualization
Context:
With the overarching intention of democratizing learning of data science (and adjacent fields), listing core competencies and noting inquiry practices is a first step. Mastery over a domain reveals interconnections between constructs, often revealed only after immersing in the topic for a long time.
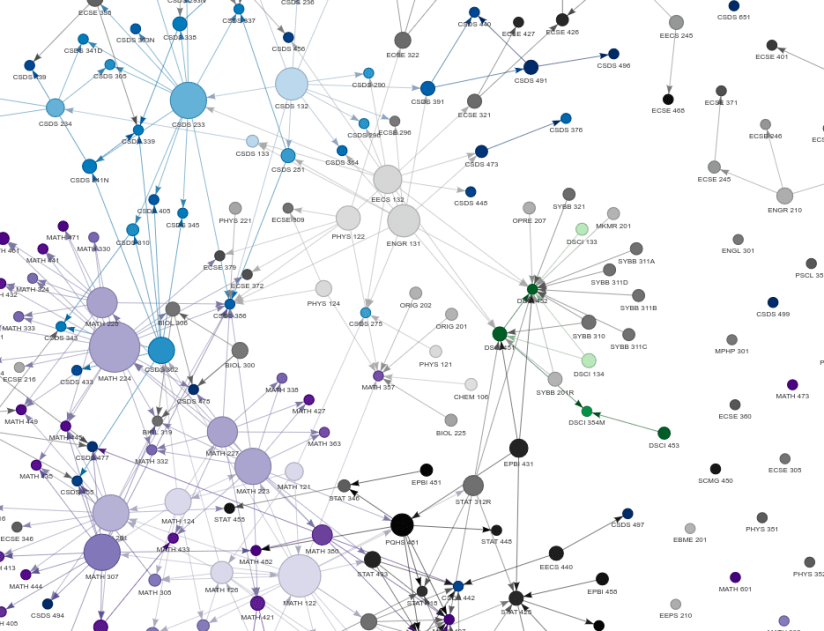
A core challenge when self teaching as a novice in a domain is the visualization and articulation of dependencies between core competencies.
This python class allows learners or researchers to create (through a python script) a self guided learning map, choosing with interest but also expert guidance on dependencies.
For example, if a student wishes to independently learn about stochastic models, they can find the course, and use the visual map to trace out all the prerequisite skills and topics.
Next Steps:
- Compositing multiple Universities’ curricula: Can these networks be used to study the underlying topics? Perhaps a LDA analysis? Can this project be extended to compare different schools’ topics?
- Adding sources: Can we tie the topic information to scholarly articles and textbooks?
- Combining scholarly crawler information to look at citation maps and topics and how that relates to university curricula summary map
Company
Self-Motivated
Timeline
Ongoing
Role
Developer & Researcher
Date Began
June 2021
Tools Used:
- System: Ubuntu 20.04 LTS, Python 3.8
- Requests
- BeautifulSoup
- numpy
- NetworkX
- Matplotlib
- PyVis, calling VisJS library (JavaScript)
